

I like bytes, they're handy! I also like laying them in the right way to make things work and work fast. It turns out I'm far from the only byte-nerd out there :)
In this post I'll dive deep into how Prometheus, an open source metrics and monitoring service, represents time series information on the disk. To write this post, I've read Prometheus' implementation, played around with real data and also read this series of posts by Ganesh Vernekar.
My goal is not to provide full documentation, instead I want to explore and learn with others' designs. I'll also speculate why some things are the way they are and compare trade-offs with other alternatives I know.
This is the first post of a two-post series. The second installment will come soon, stay tuned with the RSS feed or the newsletter!
The basic model
Prometheus' database subsystem is called tsdb (for Time Series Data Base) and stores "series". A series is uniquely
identified by a set of labels, for example: __name__ = cpu_usage, host = 123.4.5.6. While the label __name__
is treated specially on the UI and query syntax, internally it's just another label.
A series is made of an immutable sorted list of samples (timestamp: i64, value: f64). The timestamp is measured in
milliseconds.
And that's it! The actual model has two more features that I'm not covering here: histograms and tombstones.
The tiered representation
A typical deployment of Prometheus is constantly ingesting new samples for many series. For a given series, the samples are received in order. But for different series, this may not be the case.
To strike a balance between memory usage and performance, Prometheus uses a three-tier system to represent its data:
- recent samples, up to 30 minutes ago
- somewhat recent samples, up to 3 hours ago
- history samples, more than 3 hours ago
The actual timings depend on system load and configuration, but it's a good initial guess.
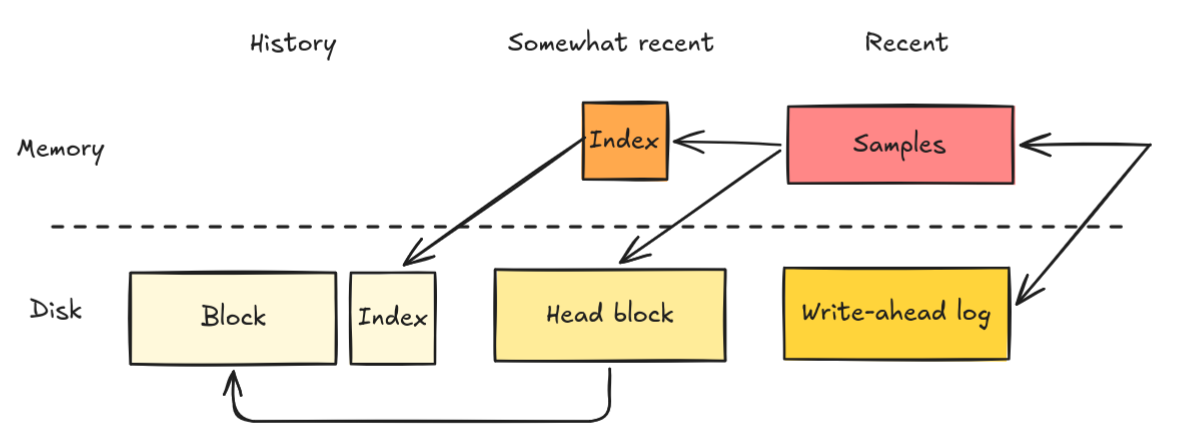
New samples are stored directly in memory, and a copy of the information is appended to the write-ahead log file. This file is mostly used during disaster recovery to reconstruct the in-memory state, when the database crashes or is otherwise shutdown abruptly.
After a while, samples are compacted and saved to the disk as "head blocks". This works especially well for Prometheus because series are immutable and samples arrive mostly with a timestamp close to the current clock. So these files once persisted do not need to be modified any more. At this tier, the index which keeps information about the series labels and where they are in the head chunk file is still in active memory.
After a while, the head chunk is compacted together with the index to the disk. Prometheus also merges older blocks to reduce the number of files and reuse index information. It also deletes very old data to reduce storage usage.
On the disk, the files look like this:
├── 01KWRYYXKSATHRGKQ2CWPDBX1B # history block
│   ├── chunks
│   │   └── 000001
│   ├── index
│   ├── meta.json
│   └── tombstones
├── ...
├── chunks_head                # head block
│   ├── 005151
│   └── ...
├── queries.active
└── wal                        # write-ahead log
    ├── 00005291
    ├── ...
    └── checkpoint.00005290
        └── 00000000
In this post I'll focus on the "history" data format stored in block folders like "01KWRYYXKSATHRGKQ2CWPDBX1B" in the example above.
What is in the index?
Let's start with the index file, like "01KWRYYXKSATHRGKQ2CWPDBX1B/index" in my example. It has two main purposes:
- store series labels and reference the actual samples data stored in files like "chunks/000001"
- store a reverse index of label names and values, so that Prometheus can use this condensed information to know which series match a given user query
Before discussing the binary representation of the data, I think it's helpful to show what "fields" are stored in the index file. I'll use Python for illustrative purposes, but there is no relationship with the actual Go codebase.
class Index:
    strings: list[str]
    # purpose nb. 1
    series: list[Series]
    # purpose nb. 2
    postings: list[Posting]


class Series:
    labels: list[tuple(int, int)]
    chunks: list[Chunk]


class Chunk:
    min_timestamp: int
    max_timestamp: int
    file: int
    offset_in_file: int


class Posting:
    name: str
    value: str
    series_indexes: list[int]
Let's start with Index.strings: it stores all the label names and values present in this block. This allows the
Series.labels elements to use the index of string on the list instead of storing the whole string again. This
technique is called "string interning" or also "dictionary coding" and it's very common in performance-sensitive
applications. It works well because operating with integers (copying, comparing, etc) is just one instruction, while
strings require external allocation and work proportional to the string's size.
Then Index.series contains the list of all series stored in this block. Remember that series are uniquely identified
by their set of labels, represented in Series.labels as a list of entries, each one with the string id for the label
name and value, respectively.
The Series.chunks stores some metadata about all the chunks of samples that compose this series in this block. The
chunks here are non-overlapping and sorted, that is: chunks[n].min_timestamp > chunks[n-1].max_timestamp. The actual
samples data is not present in the index, making the index file light-weight. The actual data is stored in another chunk
file, referenced by Chunk.file and Chunk.offset_in_file.
Note how Series.chunks is useful for answering user timestamp queries, since it's very easy to identify which chunks
do not cover the desired period and therefore don't need to be read and decoded.
And finally, Index.postings. The term "posting" may not mean much to you, you can think of it as "index entry". This
will contain all the label name and value pairs, in order, and list the index of the series that have this pair.
For example, if the block has the series a=1, b=2 and a=1, b=3, posting would be:
[
    Posting(name="a", value="1", series_indexes=[0, 1]),
    Posting(name="b", value="2", series_indexes=[0]),
    Posting(name="b", value="3", series_indexes=[1]),
]
In a sense, Prometheus indexes all the labels for you. That is part of the reason why Prometheus does not scale well if you use labels with too many distinct values. To illustrate, imagine that you have "user_id" as a label. Then each user in your system that produced a sample in this block timespan will have an entry in the postings. And this information repeats on the index of each "history" block!
This postings list is used by the query subsystem to find which series in this block match a given user query. Since
it's stored in order, it's efficient to search. For example, if your Promql is
cpu_usage{app="email", host="example.com"} it will do a multi-intersection of the series indexes for
Posting(name="__name__", value="cpu_usage"), Posting (name="app", value="email") and
Posting(name="host", value="host"). Also, note that Posting.series_indexes is sorted, so doing set operations
(union, intersection, etc) can be done efficiently.
And a final note: the Posting.name and Posting.value do not use string ids to reference Index.strings! It's
unclear to me why, though.
I've lied to you
This post is about the time series format on the disk. So the Python classes above are all a lie, but a useful lie nonetheless. In practice, the index file contains these pieces of information, in sequence:
- magic number (4 bytes): the value 0xBAAAD700
- version (1 byte): the value 0x02
- symbol table: corresponds to the
Index.stringsdata above - series: corresponds to the
Index.seriesdata above - label index: not used
- postings: correspond to the
Posting.series_indexesinIndex.postingsdata above - label offset table: not used
- postings offset table: corresponds to the
Index.postingsdata above (except forPosting.series_indexes) - table of contents: contains the byte offset where each section above starts
If you are curious, you can check the full format documentation.
The symbol table
What in Python was Index.strings: list[str] is represented as the following:
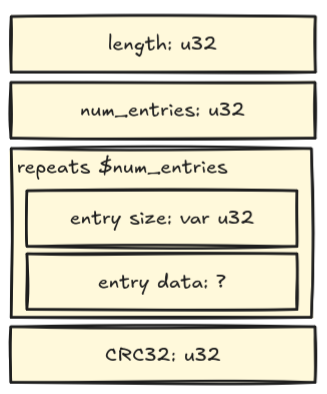
The format "u32" means 32-bit unsigned integer in big endian. So, for example, the decimal value 31415 is represented with the bytes 0x00 0x00 0x7a 0xb7.
The format "var u32" means a variable integer that can represent up to an unsigned integer of 32 bits, with smaller values using fewer bytes. The algorithm is: take the binary representation of the number and split into groups of 7 bits; prepend a bit zero to the last group and one to the others.
For example:
| Decimal | Binary | var u32 |
|---|---|---|
| 3 | 11 | 0x03 |
| 314 | 10 0111010 | 0xba 0x02 |
| 31415 | 1 1110101 0110111 | 0xb7 0xf5 0x01 |
And finally, CRC32 allows detecting (but not correcting) errors in the encoding.
An alternative to Prometheus' symbol table format
Prometheus strangely uses this variable encoding that does not allow efficient random access. For example, to get the
string at index 7, the code needs to iterate and decode the 7 preceding elements. Another approach that does allow
random access is how Apache Arrow encodes list[str], with two lists: one with all the strings back to back and one
with the start offsets in that buffer:
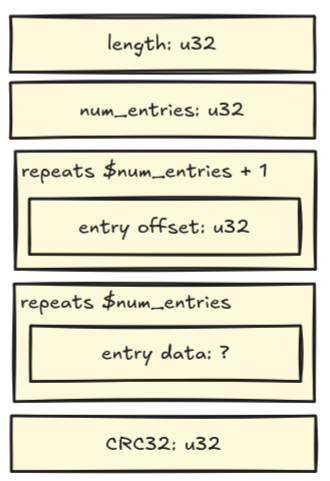
For example, encoding ["Hello", "world", "!"] uses 39 bytes:
0x00 0x00 0x00 0x23 # 35 bytes follow
0x00 0x00 0x00 0x03 # 3 entries
0x00 0x00 0x00 0x00 # String 0 starts at offset 0
0x00 0x00 0x00 0x05 # String 1 starts at offset 5
0x00 0x00 0x00 0x0a # String 2 starts at offset 10
0x00 0x00 0x00 0x0b # String 2 ends at offset 11
H    e    l    l    # all the strings
o    w    o    r
l    d    !    0x..
0x.. 0x.. 0x..      # the CRC32
Accessing the string at index n means reading the offsets at bytes 8 + 4*n and 12 + 4n, and then slicing the
buffer between those offsets.
I've tested with a real index file of mine that has 1 635 strings. With Prometheus' encoding it has 37.4 kiB. With the alternative discussed above, it has 42.2 kiB (+13%).
Prometheus' seems to get around the lack of random access support by eagerly decoding the table into a Go map. But with random access support backed into the format, this step would not be necessary. It also makes it possible to do binary search on the encoded data directly to find the id of a given string.
The series
What in Python is
class Index:
    series: list[Series]


class Series:
    labels: list[tuple(int, int)]
    chunks: list[Chunk]


class Chunk:
    min_timestamp: int
    max_timestamp: int
    file: int
    offset_in_file: int
in Prometheus' index binary encoding is:
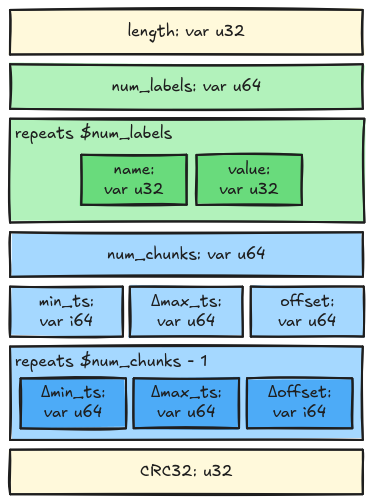
Note again the design choice of the format to privilege compactness at the cost of random access: all the labels and
chunk information are stored as variable-sized values. For example, if the reader is only interested in the chunk
information, it still needs to decode and iterate over all labels, since it cannot "jump to" the num_chunks value.
In the Python code above I've represented Chunk.file: int and Chunk.offset_in_file: int as separate fields. However,
Prometheus uses a single value with both information as Chunk.file << 32 | Chunk.offset_in_file.
To make the representation even more compact, the max timestamp and (for the second chunk onwards) the min timestamp and the offset are represented as delta values:
Δmax_ts[i] = max_ts[i] - min_ts[i]Δmin_ts[i] = min_ts[i] - min_ts[i-1]Δoffset[i] = offset[i] - offset[i-1]
This works well for timestamps because the chunks are sorted and also the delta is in the order of 100k milliseconds (minutes), while the original value is the number of milliseconds since 1970-01-01.
A few words about the var i64 encoding used above: it simply appends a zero at the end for positive values. For
negative values, it inverts the bits then appends a one. So decoding can be done as:
def read_var_i64():
    raw = read_var_u64()
    if raw % 2 == 0:
        # Positive
        return raw >> 1
    return ~(raw >> 1)
The postings
What in Python is quite simple:
class Index:
    postings: list[Posting]


class Posting:
    name: str
    value: str
    series_indexes: list[int]
in Prometheus' format gets a bit funky:
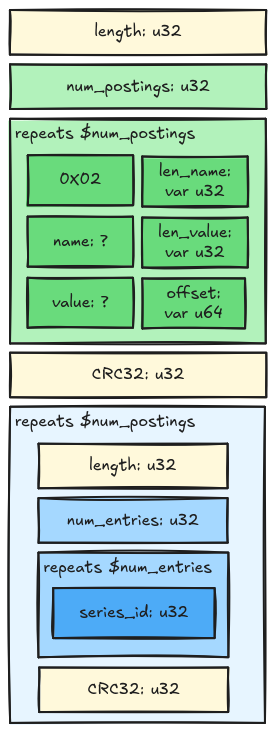
That's a lot to unpack! I don't fully understand the why's of this design, but I'll do my best to speculate ;)
The green section basically encodes list[Posting(name, value)] and the blue section encodes
list[Posting(series_indexes)]. The green section has the byte offset of the index file that contains the corresponding
blue section. When I first saw this format, I thought that it could be a trick to encode each set of series only once:
that is, if the set of series with name_1=value_1 is the same as the set of series with name_2=value_2, then two
distinct green sections would point the same blue one. But this does not seem to happen! In a real block that I had in
my server, there are 1 609 postings that represent all the distinct (name, value) pairs that are present in the block.
These 1 609 green sections are each one pointing to a distinct blue section, while in fact there are only 1 437 distinct
sets of series!
As you can see in the format above, the postings do not use the string ids in name and value, instead repeating
them. This is a bit sad for memory density, and I guess it's slower for exact matches. For example, when searching for
name=value, if the postings only contained the string ids, the query engine could translate name and value to
their equivalent ids and then search the sorted list of postings for this pair.
I guess that instead of string ids, Prometheus uses this "inlined" repetitive representation in order to be faster
when searching for regex patterns. For example, when searching for name~=.*-value (that is, label values that end with
"-value"), there are fewer memory indirections to read the value, since it's already inlined in the posting itself.
An alternative to Prometheus' postings format
As I've discussed in the previous "alternative" heading, in using variable encoding, the format loses the ability of random access. For the postings, random access is nice because it allows for fast binary searches.
If I were to redesign this part of the format for random acccess and higher memory density, I think this would be a nice starting point:
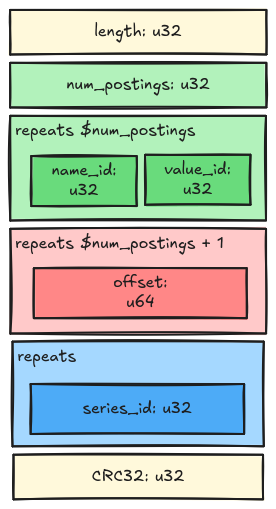
To understand the trade-offs, let's do a query name=value step by step:
- first we need to translate
nameandvalueto their corresponding string ids, using the alternative symbol table format presente before. For this example, say it wieldsname=31,value=41. - do a binary search on the green area for the pair
(31, 41). This is very fast because the code can interpret each pair as a single u64 element. For this example, say it wields index59. - find the offset start and end using the read area. For this example, we access the indexes
59and60. Say the offsets are26535and26635 - now just read the series ids from the blue area between those two offsets
Next station: the actual samples encoding
This post is getting a bit too long, so keep tuned for the next half that will discuss the neat packing of the series' samples. 🤓 You can subscribe to the newsletter or consume the RSS feed.
Leandro at 2026-07-21 22:27 UTC
Nice 😊
answer
Thanks ^^
I no longer remember why I got into the weeds of this format in the first place 🤪
answer