

In this post I share the third and most recent iteration on the uptime monitoring for all my homelab services. The main job of this subsystem is to alert me when some web service is down.
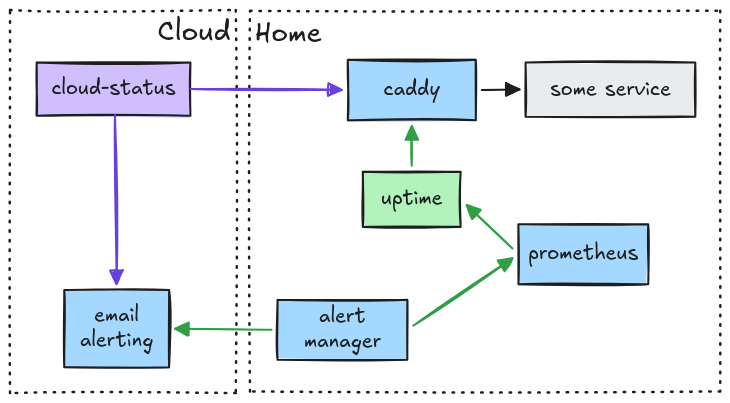
I have two different systems that detect and alert uptime issues on my homelab services: cloud-status and uptime.
Both are small pieces of Rust code that I've written for my use case. They both read my Caddyfile to know which hosts
I have and probe them one by one.
The main difference is that cloud-status probe from the point of view of the outside, using an hourly job that runs on
some cloud provider. While uptime probes from the inside of the homelab, every fifteen seconds.
Cloud status
This is a job that will run on a cloud server every hour to check that:
- my private services that only answer to private IPs are not available on the Internet
- my protected services that require knock protection redirect to the login page
- my public services answer with 200
In case of any problem, it will notify me by email, describing the issue. When the issue is resolved, it notifies me again.
I've deployed this as a cloud job in Scaleway. I was surprised by two limitations of their platform:
- jobs do not have IP v6 connectivity. Yes, it's 2026 and their service only offers IP v4... So I unfortunately cannot test if the IP v6 routing is still good. This is not a hypothetical problem: I once had a problem in which a friend could not access a website I host because their phone only had IP v6 and my IP v6 setup was wrong. It confused me for a while because "it worked for me", but not for him...
- jobs cannot connect to SMTP port to send me an email. It's a measure to combat SPAM on their infra. So I had to enable their transaction email service and use their API for this.
In all, this costs me around € 0.30 / month.
The source code is here if you want to take a look.
Uptime
To monitor and alert about private and protected services being down, I need to do it from the inside.
My first attempt was made using Caddy's health check feature, but it had a major downside: Caddy also uses the current health information to decide whether it allows the request to continue to the underlying service or, when unhealthy, respond right away with 502 Bad Gateway.
This behaviour was painful for two reasons:
- the Collabora Online container on startup needs information from the Nextcloud instance, and it uses the public domain name to try to reach the instance. Well, when the homelab is starting, Caddy would not have yet detected that Nextcloud is healthy, answering Collabora with an error and breaking it.
- when I would deploy some other service, depending on how unlucky I was with the health check probes timing, Caddy would mark a service as unhealthy, increasing the downtime more than necessary.
My second attempt was made using Uptime Kuma, but it didn't fit well my use case for two reasons:
- I would need to manually enter each domain to monitor. I want something automatic or at least that fails safe if I forget to add the monitor.
- it used too many resources! It would consume around 130 MiB of memory and 1.5 % of a CPU core. That's insane for such a simple task.
So my third attempt was writing my own, which parses my Caddyfile to automatically monitor all my hosts. It exposes a
/metrics endpoint that is scrapped by Prometheus and with an alarm rule in alertmanager, I can receive email
notifications.
The source code is here if you want to take a look. It works wonders for me and only uses 4 MiB and 0.2 % of a CPU core.